
In the previous articles, we have seen the effect of emotions in the engagement and then we also saw how these effects in the online class. In this article, we will see the research overview of the project EdGage.
During our initial literature survey we have identified that emotions of student is a driving factor for their engagement in the class. We have taken this literature survey and used the power of AI to understand the engagement of student during the online class. The objective of the research was to create a model which can successfully identify the various emotions and then analyse it to get an engagement score. During, the study, we couldn’t find any proper algorithm which can give us a certain level of engagement score. So, it was important for us to identify various factors which determines the engagement of student. The first step was to do a survey and create a basic model and compare it manually.
The idea was to create a basic model and then evolve it to attain the close result. The other main challenge was to create dataset for training our model, as there was no dataset that was available which we can use. The research was divided into three main part:
- Engagement measured through AI (EGS – EdGage Score)
- Manual score from the experts (ES – Expert Score)
- Score calculated through the student’s feedback (SS – Student Score)
Based upon all these three input we tried to identify the anomaly in our model and make correction to attain the high confidence level. We started by extracting the emotions of students who were in the online class. We categorized this into the 8 different emotions: CALM, SAD, SURPRISED, HAPPY, CONFUSED, ANGRY, FEAR, DISGUSTED (you can read the previous article to know more about these emotion choices). We have limited our research to emotion but have been working on including other factors to give us better engagement score (you can read about this in our future articles).
During, the first leg of research we asked students to watch an educational video which of topics of their choice. We recorded the student’s session and once the video got over, we asked student to answer some basic question based upon the video to see how much the student was able to grasp the concept. After the small quiz session, students were given with a few simple feedback question. These feedback questions gave us the Student Score (SS).
The student’s session was shown to the expert who gave us the Expert Score (ES). The pool of expert was coming from the teaching & psychology background. These scores were compared with the AI generated score to understand the underlining differences in the research.
First leg pilot program was run in L.S. College, B.R.A. Bihar University. We had 20 test subjects (students) who participated in this research.


The initial research gave us a good result, the average ES was around 86 while the SS was 88 and on the other hand, our EGS was 79. Based upon the result obtained a small graph was plotted to show the variations with respect to other metrics.
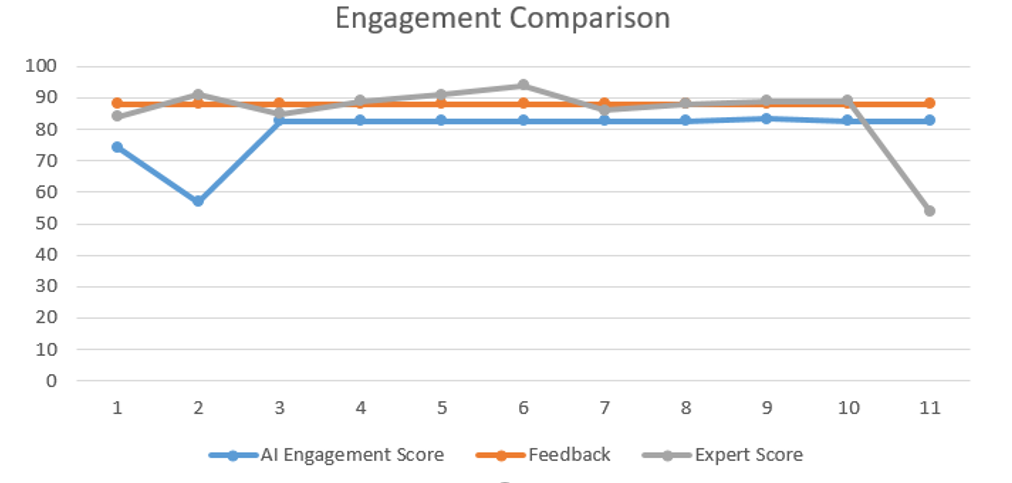
In the first look, it seems like we attained 90% of the accuracy but later we realized that there were many other factors that affected our result. We are working to eradicate this factor and get a more detailed result. In the next article, I will talk about these factors and how we handled them. I will also share the result from the second leg of research that is being conducted in JIMS, Rohini, New Delhi. For this first leg of the research, I would like to thank Dr. Tarun Kumar Dey, Dr. Navin Kumar from L.S. College, B.R.A. Bihar University for the successful completion of the first leg of research.